
What was the object of the experiment?
Primarly the experiment should show the irrational voting behaviour of people. For that, the opinion of 25 different questions was collected by introducing a third vote to the prevailing election system with two votes. Every list standing in the election gave its opinion to this 25 questions. (Explanation: At the StuPa election we do not speak of parties, but of so called lists).
Thus, it can be analysed if the opinion of the voter is consistent to the opinion of the elected list.
Results
First we want to take a look at the result of the experimental election to the KIT Student Parliament after exclusion of invalid ballots and replacements of missing answers to neutral (Image 1).
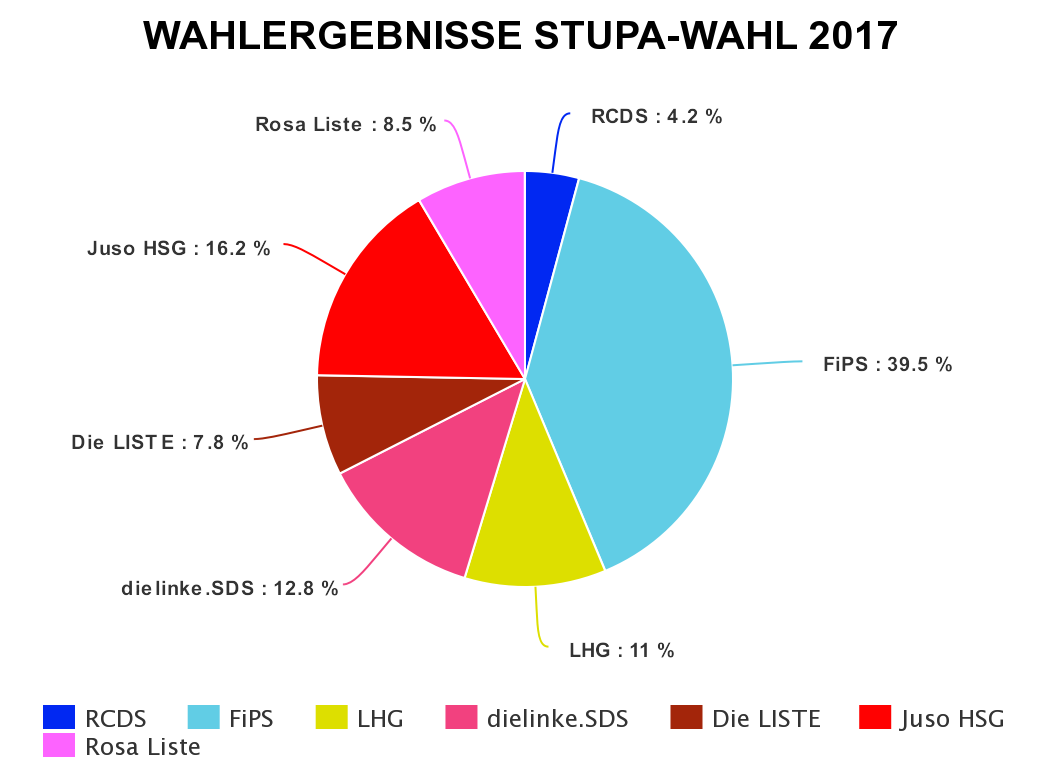
In fact, we could detect rational voting behaviour at the StuPa elections. FiPS is the most voted as also the most representative list measuring only the consistency of the voter's opinions.
We introduced the variables Popularity and Universality to measure the real consistency of voters with the elected list. In the following they are shortly explained:
- Popularity: Popularity expresses the part of the voters, that have the same opinion as the analysed list, averaged over all 10 questions. It is the average percentage of the population represented.
- Example: The Juso list reaches a pupularity of 50 %.
The Juso list rejects question 1. 31 % of the voters reject question 1, too.
The Juso list rejects question 2. 49 % of the voters reject question 2, too. All these percentages are added and divided by the number of questions.
At the end we obtain the part of the voters that have the same opinion as the Juso list.
- Example: The Juso list reaches a pupularity of 50 %.
- Universality: Universality is the percentage of the questions, in which the opinion of the list is the same as of the majority of voters.
- Example: The LHG reaches a Universality of 60 %. The LHG represents in 15 of 25 questions the opinion of the majority of voters - i. e. 60 %.
Important: Here only the consistency with the opinion of the majority to each question matters.
- Example: The LHG reaches a Universality of 60 %. The LHG represents in 15 of 25 questions the opinion of the majority of voters - i. e. 60 %.
We analysed also the difference between the voting behaviour of voters who used the voting advice application StuPa-O-Mat before the election and were determined by the StuPa-O-Mat (s) and of the ones who did not do so (n). Furthermore we seperated the StuPa-O-Mat users into 'little influenced by the StuPa-O-Mat' (~) and 'not influenced by the StuPa-O-Mat' (≠). The quantity of voters is described by (a).
According to the analysis students who did not use the StuPa-O-Mat vote more irrationally than students who used it before. In the image 2 the results can be observed.
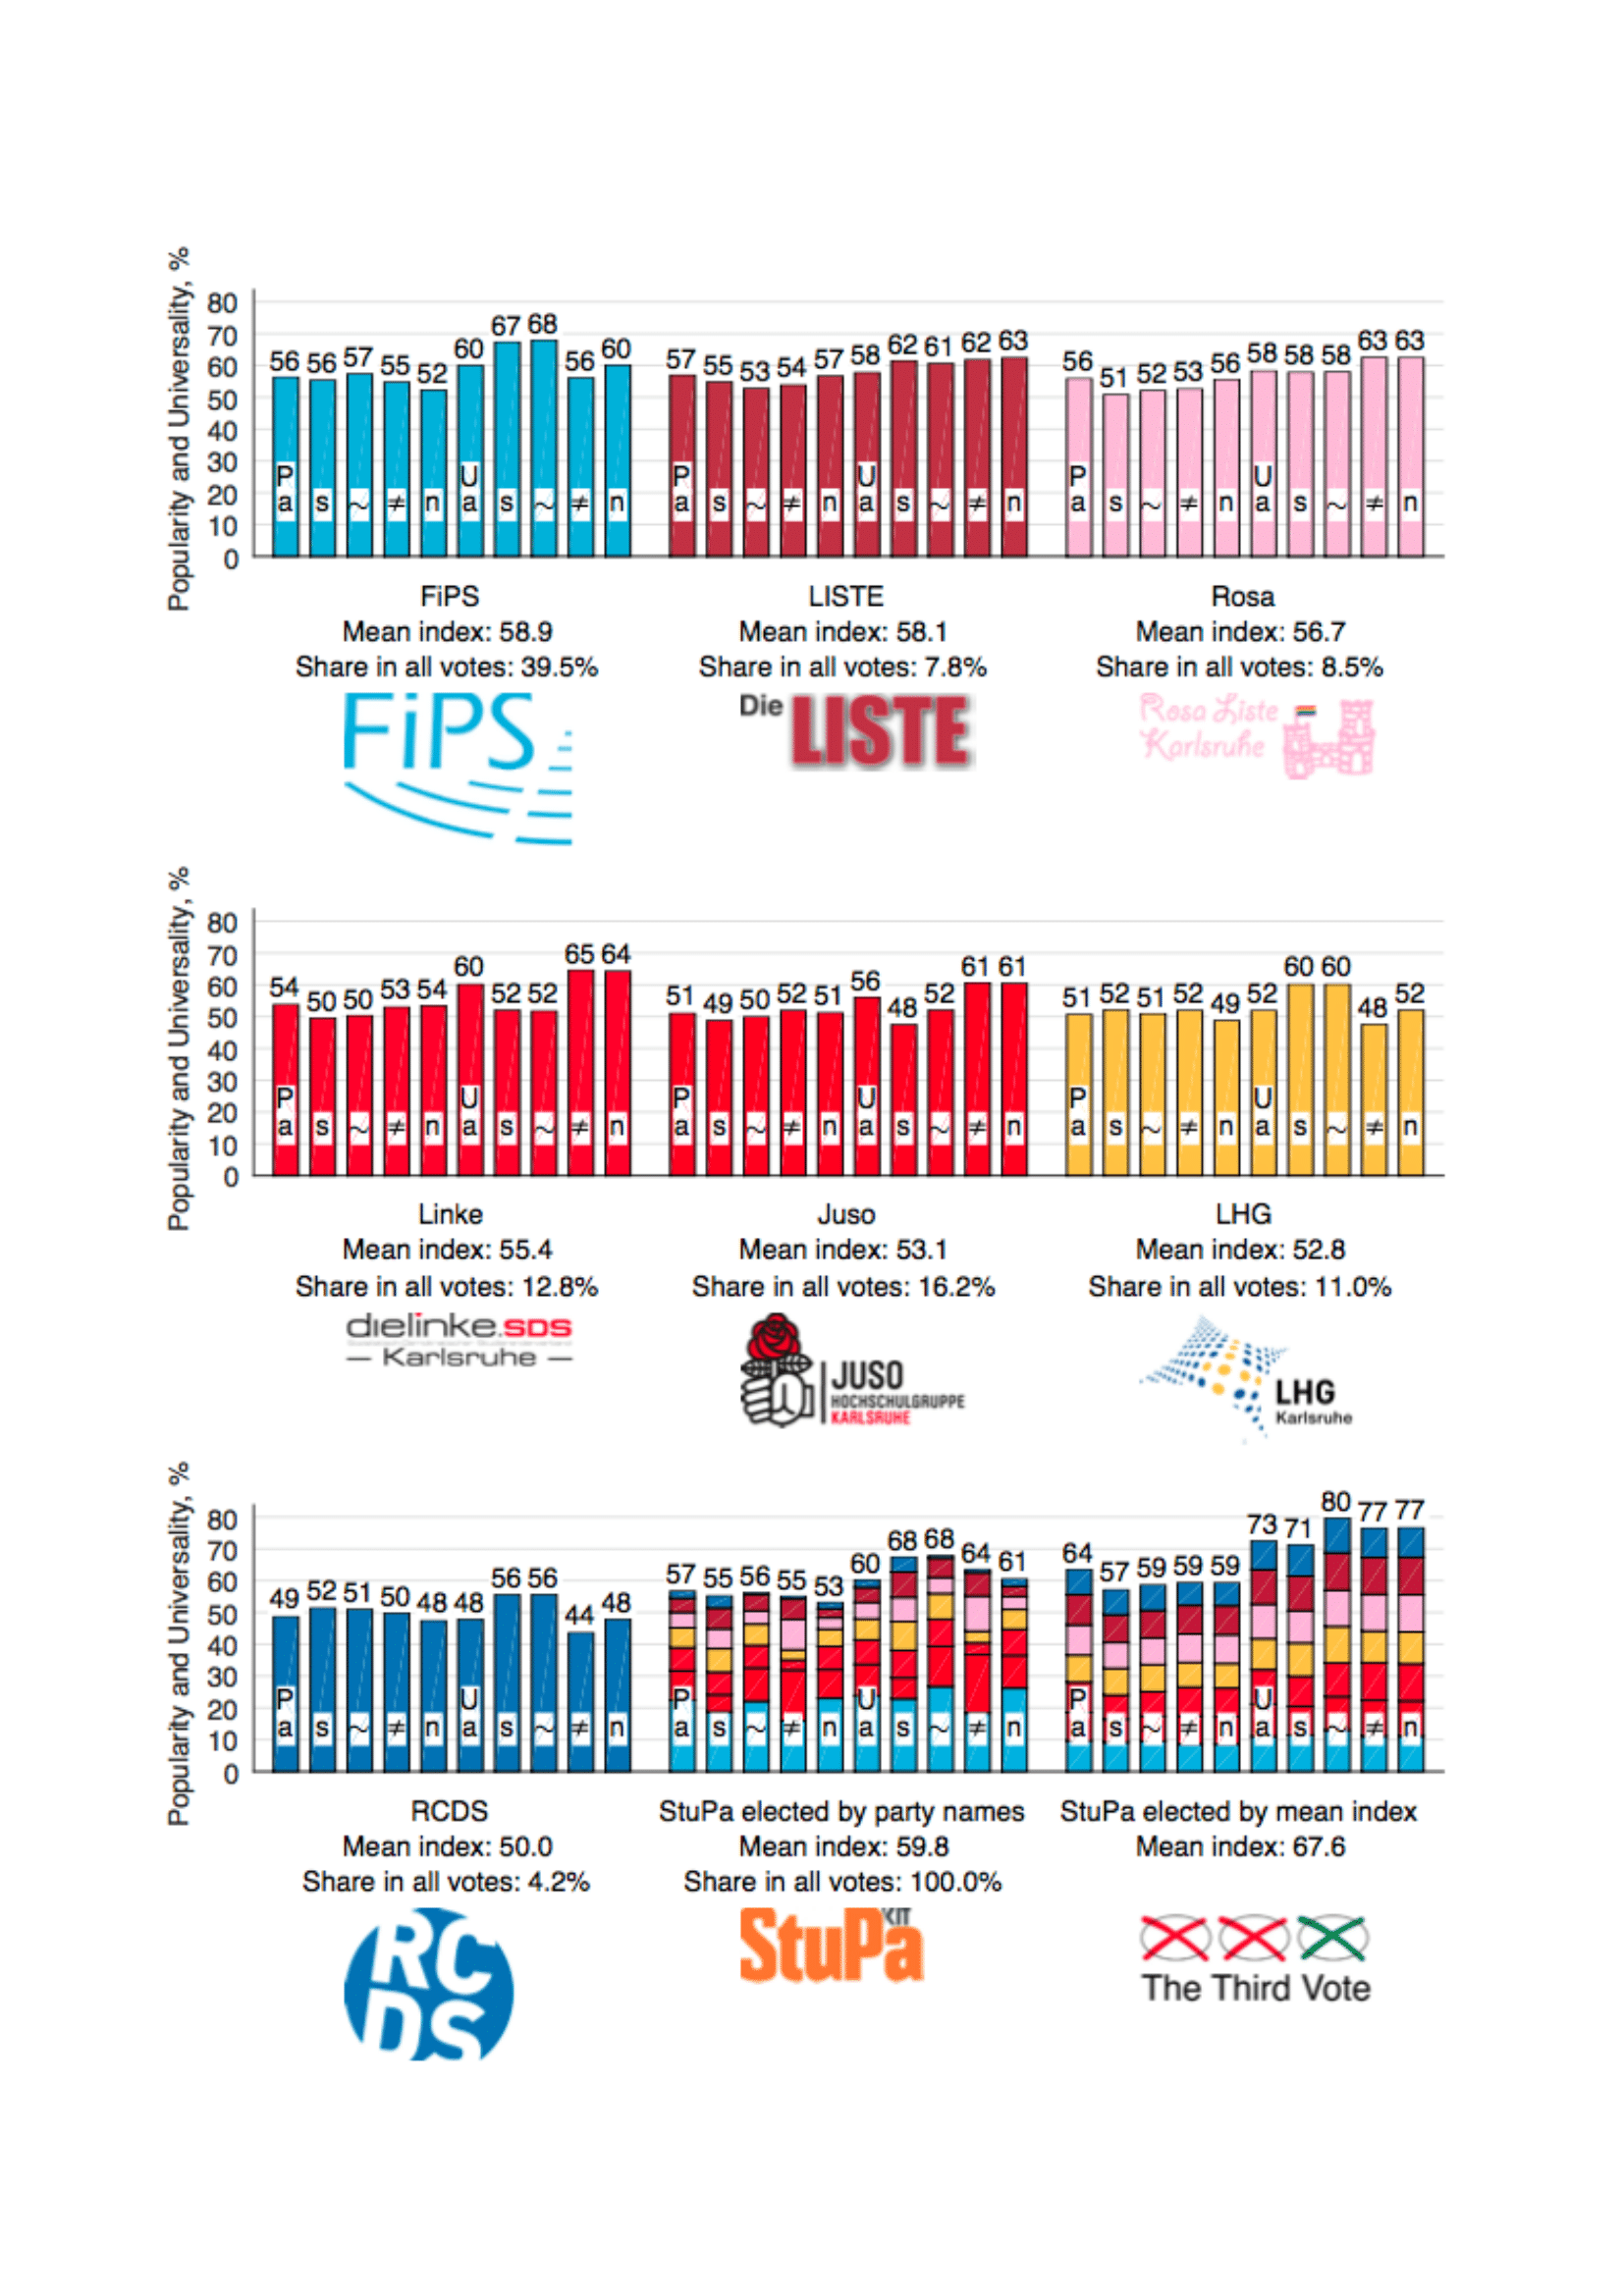
The Indices of Popularity (P) and Universality (U) of the prevailing list are shown for all groups of voters (a, s, n, ~, ≠).
The Mean Index represents the average of the Popularity and Universality.